imagine
empower potential™
empower
potential™
learning
Solutions that inspire boundless possibilities:
every day, every student

Core Curriculum
- Encourage student-centered learning
- Build essential skills
- Nurture lifelong learners

Courseware
- Accelerate personalized learning
- Facilitate credit recovery
- Support students’ academic goals

Supplemental and Intervention
- Deliver personalized learning
- Encourage skill practice and mastery
- Tailor learning for grade-level success

Instructional School Services
- Fill your teacher vacancies with Certified Instructors
- Expand your course offerings with our standards-aligned course catalog
- Build your virtual programs with support
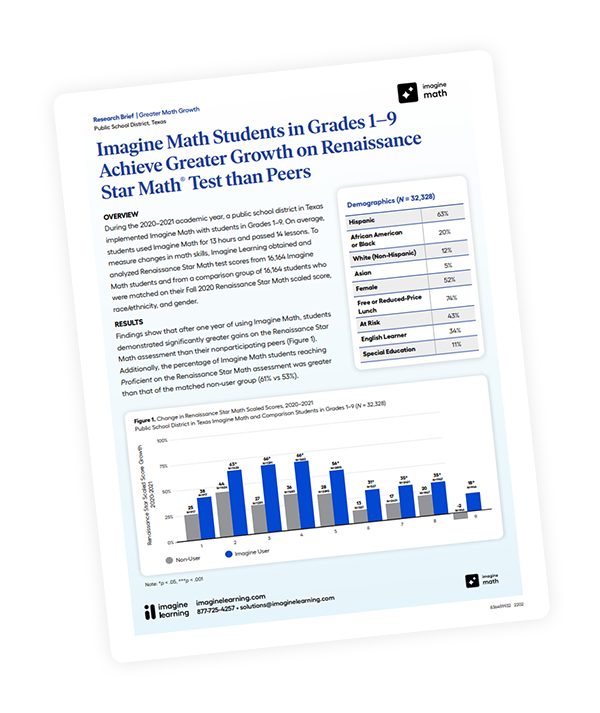
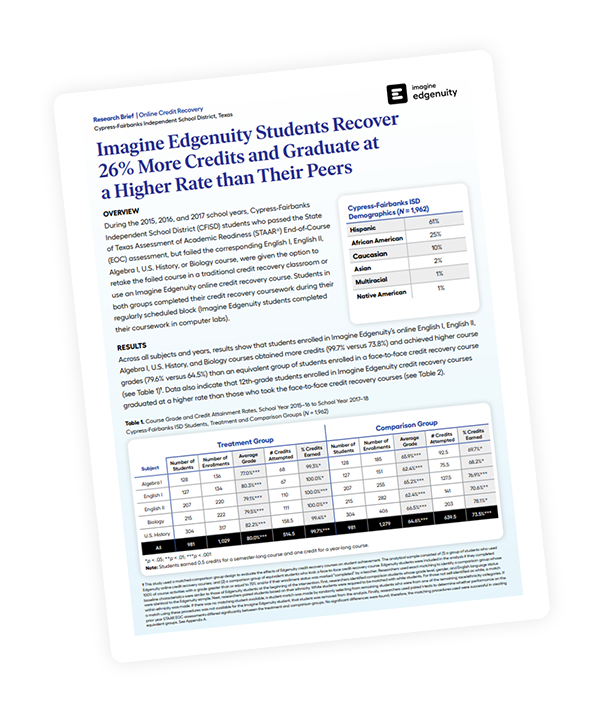
Our Latest Research


Community & Careers

The Teachers’ Lounge
Network, collaborate, grow, and innovate with peers in a community space designed for educators.

Imagine Learning Careers
Seeking lifelong learners who want to empower educators, engage students, and connect families to learning.